.jpg)
Resolve the place
A stable GeoNames ID anchors each town, village, or city to coordinates. Similar names never count as a geographic match.
Travel, timed beautifully
Find the best time to visit 1.27 million towns, villages and cities. Where nearby measured weather passes the evidence checks, get a clear month-by-month answer.
Your climate match
May leads for comfortable days: typically 23.6°C by day, 15.4°C at night, and 141 mm of rain.
Featured evidence
These hand-checked examples show the full result experience. Search covers every place whose nearest station clears the evidence checks — the rest are left out rather than filled in.
Japan
Thailand
Iceland
Portugal
United Kingdom
United States
Australia
South Africa
Morocco
Singapore
Mexico
Italy
See the subject
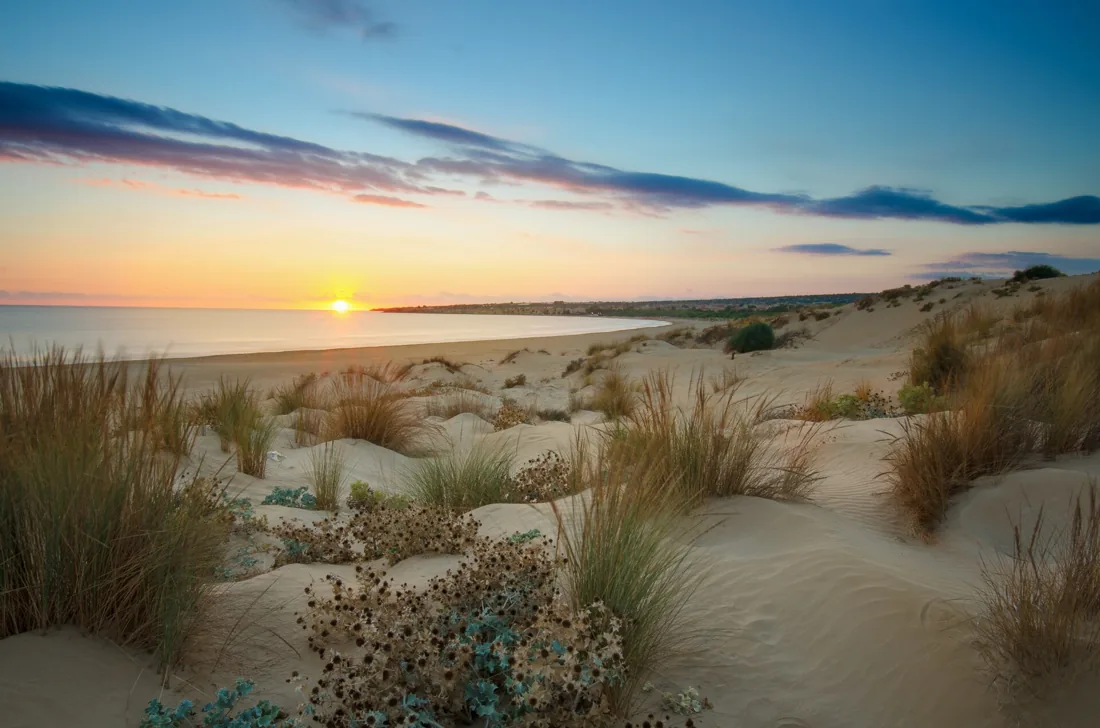
Use the monthly temperature, rainfall and coverage evidence to plan your trip. A photograph records one moment in one place; it cannot predict the weather for your dates.
Evidence before adjectives
We start from every GeoNames settlement, then keep the 1.27 million whose nearest station clears the distance, coverage and elevation checks. Every result keeps its source station, distance, period, and month-level coverage.
A stable GeoNames ID anchors each town, village, or city to coordinates. Similar names never count as a geographic match.
Nearby NOAA GHCN stations must cover every month in 1991–2020 for daily high, low, and precipitation observations.
Comfort, beach, and outdoor scores use different temperature targets. Rain and wet days reduce the score.
Every page carries its station’s record highs and lows with the dates they were set, how the last fifteen years compare with 1961–1990, and a stripe per year of the full record.
Thin months are labelled, and a change is only shown where both periods are deep enough to compare. Climate history is not a forecast, and the nearest station may not reflect mountains or microclimates.
What is live in this MVP
In use: 2.7 billion NOAA GHCN daily observations, 1763–2026 (US federal public-domain data), against GeoNames place identity (CC BY 4.0) — 1.27 million places across 11,839 qualifying climate stations.
New England context: 5,524 Environment Agency station source records (5,523 with stable identifiers) plus its complete current-flood snapshot, both imported under OGL 3.0 and kept separate from historical climate.
Held back: accommodation, offers, and private affiliate feeds remain excluded until the relevant site and merchant publication rights are recorded.
Environment data now
The climate explorer remains global and historical. England now has a separate operational layer so a current flood record is never mistaken for a monthly normal—or a zero snapshot for a safety guarantee.
Complete feed state, timestamp, explicit zero and unavailable semantics.
Open the current view →5,523 identified stationsSearch by town, river, catchment and published measurement capability.
Search the network →Future gateClimate bulk data remains unavailable until its credentialled job and downstream rights are approved.
See source status →Browse instead of search